Dashboards and widgets
Create a dashboard across one or more boards, add charts, numbers and other widgets, and filter what you see.
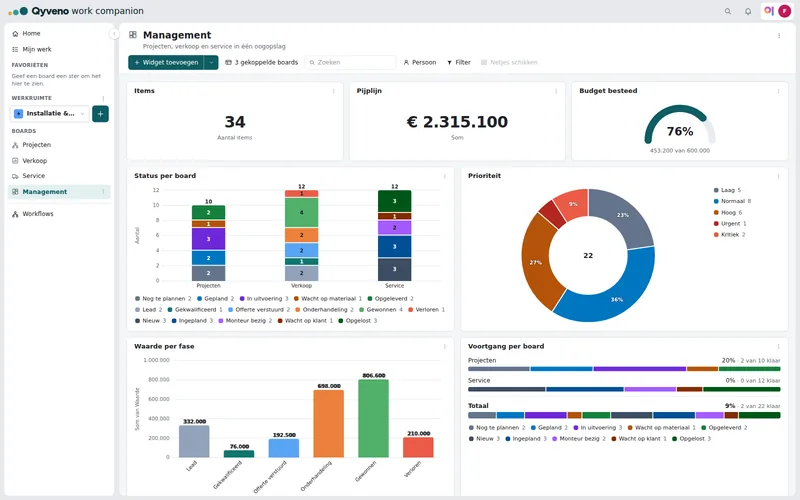
A dashboard brings the figures of one or more boards together on a single page. At a glance you see how much is still open, how far projects have come and who is busy. Everything updates live: when something changes on a board, you see it right away.
Creating a dashboard
- In the sidebar, click the + (Add to workspace) and choose Dashboard. You can also do this inside a folder, through Create in folder.
- Give the dashboard a name.
- Under Which boards, pick the current board, all boards in the workspace, or Choose.
- Click Create dashboard.
The dashboard then appears in the sidebar, among your boards. To change which boards belong to it later, use the connected boards button in the toolbar. The … next to the name lets you duplicate, move or delete the dashboard.
Don't see Dashboard in the menu? Then your role doesn't have the Create and edit dashboards permission. Your admin can change that. Viewers can still look at dashboards.
Adding widgets
Click Add widget and pick a widget, or choose All widgets to open the Widgets Center, which explains each type. These are the widgets:
- Chart: pie, donut, bar, column (horizontal), line, area or bubble, optionally stacked by a second column.
- Numbers: one big number, such as the number of items or the sum, average or median of a column.
- Battery: how much is done, in the colors of your status labels. With several boards, one bar per board with the total below.
- Gauge: a number against a goal, with a percentage.
- Table: items from several boards in one table, per board or per group. You can edit them here too.
- Overview: one line per board with its progress as a percentage.
- Workload: planned work per person per week. See Workload.
- Gantt: the schedule of the connected boards as bars, with dependencies. This one is view-only; you move bars in the board's Gantt.
Click a slice of a chart or battery to see the items behind it.
Setting up a widget
Open a widget's menu and choose Settings. The widget goes full screen, with the Widget settings on the right. Changes show up immediately. For a chart you choose, among other things, the Chart type, the X-axis, the Y-axis and Stack by. Under Boards you choose which connected boards (and their subitems) the widget uses, and under Groups which groups.
If your boards have columns with the same name, choose All at once: the widget adds those columns together. With One by one you pick a column for each board yourself.
The same menu also has Rename, Duplicate, Full screen and Delete.
Arranging and filtering
- Move: drag a widget by its header. Resize: drag the bottom right corner.
- Tidy up in the toolbar lines everything up: key figures at the top, charts in rows of two, with no gaps.
- Person and Filter in the toolbar apply to the whole dashboard, for everyone. The search field is just for you.
- Each widget also has its own filter: the small funnel next to its title. When a filter is set, the funnel is highlighted.
On a phone the widgets are stacked in one column. Moving widgets and tidying up is done on a computer.