Planning with the Gantt
Show your items as bars on a timeline, link them with dependencies, and keep an eye on milestones, baselines and the critical path.
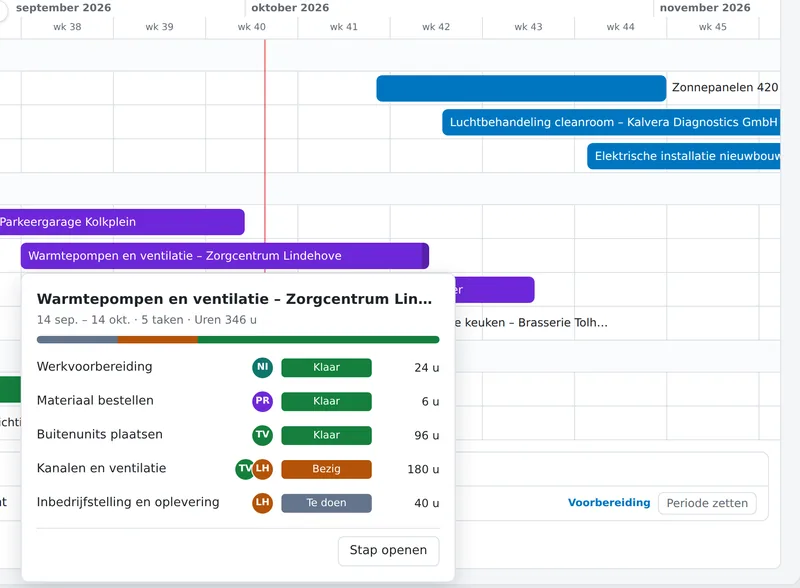
The Gantt shows the items of a board as bars on a timeline. You see what happens when, what is waiting on what, and what is running late. Dragging a bar updates the dates straight away.
Creating a Gantt
The Gantt draws one bar per time period. Your board needs a column of the Timeline type for that, or a Date column (which becomes a one-day bar). To learn how to add a column, see Columns.
- Next to your board's views, click + (Add view).
- Choose Gantt.
- If your board has more than one timeline column, pick the one the Gantt should draw.
To move a bar, drag it. Drag its start or end to make it longer or shorter. Click a name on the left to open the item.
The toolbar
- Scale: Days, Weeks, Months, Quarters or Years.
- Zoom: use − and + to make the days narrower or wider.
- Auto Fit: picks the scale and zoom so all bars fit across the screen.
- Today: jumps to today. The red line marks the current day.
- Settings: everything about how the Gantt looks (see below).
- Export: PDF (print) or Excel (.xlsx), of what the view currently shows, up to 640 rows.
The date header and the names column stay in place while you scroll. Use the arrow on the edge to collapse the names.
Settings
Under Settings you can choose, among other things:
- Group by group, or a single list by start date, plus a Group summary in the group header.
- Subitems with their own bars.
- Bar label and Color by (group, person or a status column).
- Hide weekends in the Days and Weeks scales.
- Milestones: a milestone gets a small diamond in the middle of its bar. You set this per item with the Milestone checkbox in the timeline cell. Here you can also show every one-day item, or items with a certain label, as milestones. An overdue milestone that isn't done yet gets a red border.
Changes are only visible to you at first. Save to view applies them for everyone.
Dependencies
Is one task waiting on another? Add a column of the Dependency type. In that cell you pick the predecessors: the items on the same board that this item waits for. An item that is still waiting gets a small clock. In the Gantt, arrows appear between predecessor and successor. If a successor starts too early, the arrow and the bar turn red.
- For each predecessor you choose the type (Finish → start, Start → start, Finish → finish or Start → finish) and, if you like, a delay in days.
- Want to put a series of items in sequence? Select them and choose Dependencies in order in the bar at the bottom.
- In the column menu › Settings, under When a predecessor moves, choose what happens: Flexible (a successor only moves if it would otherwise start too early), Strict (successors keep their distance) or No action. With In working days, only working days count.
When items have moved along, a notification shows how many, with an Undo button.
Baselines and critical path
A baseline is a snapshot of your schedule. In the settings, choose Save baseline. Each bar then shows a grey shadow of the old schedule underneath, and how many days it has shifted. You can keep up to five baselines and pick the one you see under Compare with.
Turn on Show critical path to see, in red, the chain that determines the end of your schedule. If one of those tasks runs late, the end date moves with it. The critical path needs dependencies.
Want to see the schedule of several boards together? Put a Gantt widget on a dashboard.